GANterpretations
GANterpretations is an idea I published in this paper, which was accepted to the 4th Workshop on Machine Learning for Creativity and Design at NeurIPS 2020. The code is available here.
At a high level what it does is use the spectrogram of a piece of audio (from a video, for example) to “draw” a path in the latent space of a BigGAN.
The following video walks through the process:
GANs
GANs are generative models trained to reproduce images from a given dataset. The way GANs work is they are trained to learn a latent space $ Z\in\mathbb{R}^d $, where each point $ z\in Z $ generates a unique image $ G(z) $, where $ G $ is the generator of the GAN. When trained properly, these latent spaces are learned in a structured manner, where nearby points generate similar images.
BigGAN
I use the BigGAN model, which is a class-conditional GAN. In high-level terms, this means that the latent space is of the form $Z\times C$, where $Z\in\mathbb{R}^d$ and $C$ is a finite set of possible categories (such as jellyfish, bike, and boa). BigGAN has 1000 categories, and you can see generated samples from all of these here. For example, here are three samples from the agama category:

Latent space interpolation
Properly trained GANs thus allow us to perform smooth interpolations between images in the same category $c\in C$ ($G((1 - \alpha) (z_1, c) + \alpha (z_2, c))$), and images from different categories $c_1,c_2\in C$ ($G((1 - \alpha) (z_1, c_1) + \alpha (z_2, c_2))$). Here we show a sample interpolation between three different types of generated dogs:

We can use any signal in $\mathbb{R}^d$ for our $\alpha$ values, and in the next section I’ll explain how I use the spectrogram from an audio file for this purpose.
Spectrograms
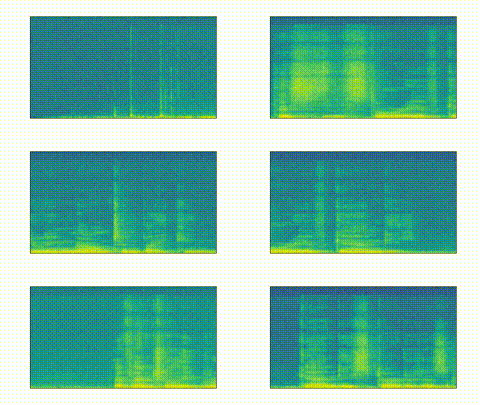
Given an audio file (could be the audio extracted from a video file), I use the specgram method from matplotlib to extract the spectrogram of an audio file. Most audio is in stereo, but I only use the left channel. The extracted spectrogram for the GANdy example is as follows:

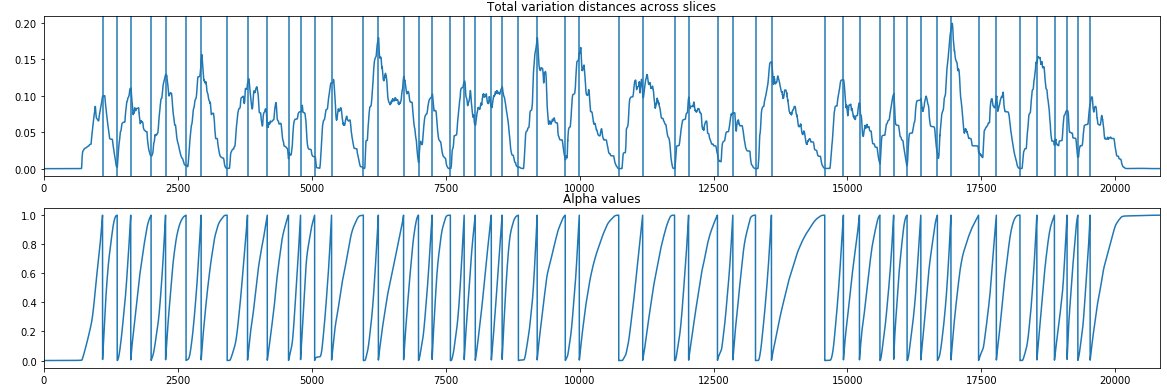
This is an $ m \times n $ matrix, where $ m $ is the number of timesteps and $ n $ is the number of frequencies. Let $ F_t $ be the spectrogram at time $ t $; I compute the Total Variation distance $ TV $ between $ F_{t-1} $ and $ F_t $ and we’ll denote this value as $ TV(F_{t-1}, F_t) \in\mathbb{R} $. The following image displays the TV distances for our running GANdy example.

Inflection points
We “slide” through the TV distances across the timesteps to find inflection points. These are points along the timeline where there is a “peak” in the distances.

In words, what we are after are points that are extrema (i.e. the highest/lowest point within a certain window); note that we also add the first and last points in our timeline as inflection points. In our running GANdy example, we might get the following inflection points (this was generated with an inflection threshold of 1e-2):

In code, this is implemented as:
def get_inflection_points(arr, threshold, absolute_threshold=8e-2,
                          type='both', rolling_length=200):
  inflection_points = [0]
  i = 0
  while i < len(arr) - rolling_length - 1:
    prev_mean = np.mean(arr[i:i+rolling_length])
    curr_pos = i + rolling_length + 1
    next_mean = np.mean(arr[curr_pos+1:curr_pos+rolling_length+1])
    is_peak = (
            np.sign(arr[curr_pos] - prev_mean) ==
            np.sign(arr[curr_pos] - next_mean) and
            np.sign(arr[curr_pos] - arr[curr_pos-1]) ==
            np.sign(arr[curr_pos] - arr[curr_pos+1]))
    if (is_peak and
        np.abs(arr[curr_pos] - prev_mean) > threshold and
        np.abs(arr[curr_pos] - next_mean) > threshold):
      if ((type == 'min' and (arr[curr_pos] > arr[curr_pos-1] or
          arr[curr_pos] > absolute_threshold)) or
          (type == 'max' and arr[curr_pos] < arr[curr_pos-1])):
        i += rolling_length
        continue
      inflection_points.append(curr_pos)
      i += rolling_length
    else:
      i += 1
  inflection_points.append(len(arr) - 1)
  return np.array(inflection_points)
Alpha values
Now that we have inflection points the next step is to create $\alpha$ values between each pair of inflection points. To do this, we simply normalize the cumulative sum between inflection points, which will result in $\alpha$ values going from $0$ (at the first inflection point) to $1$ (at the second inflection point). Our running example would be:

In code, this is simply:
def get_alphas(arr):
  cumsum = np.cumsum(arr)
  total_sum = np.sum(arr)
  return cumsum / total_sum
Category selection
Finally, we need to pick a category, from the 1000 possible BigGAN categories, for each of the inflection points. We can either specify these manually (which is especially useful when you’re trying to have the images match the words in the audio), or have the system pick categories randomly.
Examples
Here are some examples of some GANterpretations I’ve generated. Click on the GIFs to open each video.
Bachbird
I recorded myself playing Bachbird (my mashup of The Beatles’ Blackbird and J.S. Bach’s Prelude in C# Major), applied the GANterpretation process to it, and then combined the videos. The categories were not pre-selected (they were chosen randomly).
The story of GANdy
I selected the categories manually to match the narrative of this curious fellow.
Latent Voyage
I generated a melody using Music Transformer and then made a GANterpretation video of the audio. The categories were manually selected around the theme of “voyage”.
Modern Primates
Another melody generated using Music Transformer and a GANterpretation video of the audio. The categories were manually selected around the theme of “primates”.
Zappa
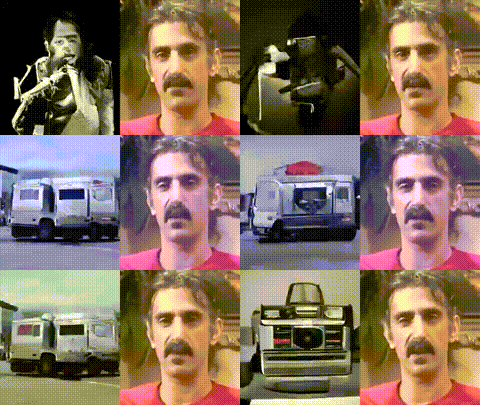
Frank Zappa talks about how much he likes music videos. The categories for the GANterpretation were chosen manually to match the words.
GAN leap
One small step for man, one GAN leap for mankind. The categories were not pre-selected, they were chosen randomly (the rocket ship at the end was pure coincidence!).
comments powered by Disqus


